Do you dare to make an even slightly important decision from any sudden whim? Sure, there is a probability that you are a lucky one, but it’s better to remember there’s always a chance to lose, which can be quite painful, especially if you play at high stakes.
If you play a poker game, relying on your gut feeling often works, which can’t be said about business. Each step and every significant decision must be underpinned by something, and of course, we mean data.
However, data by itself don’t bring any value. They must be carefully extracted, filtered, and presented, which is not an easy task to tackle. However, nowadays, there exists a pool of special tools that significantly alleviate this challenge, and here we speak about low-code/no-code (LC/NC) data analytics and visualization platforms.
But why are such tools on the rise at the moment? What are their upsides and drawbacks, and why does it make little sense to develop an entirely custom data visualization solution? Let’s discuss low-code/no-code development in the context of data and find answers to the questions above.
Ahead of the Rest. Why Low-Code/No-Code Solutions for Data Visualization Are on the Rise

Analytics and visualization are needed by every business. Meanwhile, not everybody is ready to invest huge amounts of time and money to develop a tailor-made solution, and it’s quite understandable.
As a result, there appeared many low-code/no-code solutions intended for these aims. Power BI, MS Fabric, Tableau, and QlikView — are just a few popular tools widely adopted by companies. But have you noticed that it’s a rare case when businesses decide in favor of custom development to gain analytics and reporting in comparison with other types of software?
The reason is simple: if we speak of low-code or no-code data analytics and visualization, all the related tasks are typical, and the vast majority of issues can be easily covered by the platforms we’ve mentioned. Exceptions are only super-specific algorithms absent in a tool or exorbitant volumes of data that can hardly be handled by LC/NC solutions.
Therefore, using conditional Tableau, the chance that we’ll rest against the limitations of the solution is truly negligible. This can’t be said about other software types, where specific tasks and business requirements change are not rare at all, and deciding in favor of an LC/NC solution can come back to haunt serious problems.
Learn if LC/NC and Traditional Development Are Competitors or a Powerful Duo
The Best of Low-Code/No-Code Data Visualization Solutions
Quick and Easy Dashboard Creation
The best upside of low-code and no-code platforms is considered to be simplicity of usage and no need to have specific knowledge and development skills. In general, almost anybody who undergoes small training or watches a couple of educational videos on YouTube will be able to create visualizations at a basic level.
Obviously, it won’t be a work of art, but in many cases, it’s not really needed. Over time, a conditional marketer needing some statistical data will be able to create quite decent dashboards. This follows another advantage worth mentioning — a low entry threshold. You don’t need to be well-versed in programming languages or analytics tools; the platform capabilities allow you to do this with a one-two punch.
Impressive Flexibility and Scalability

Low-code/no-code platforms are designed with built-in tools that make it easy to scale and adapt systems as your business grows. These platforms often support seamless integration of new data sources, enabling you to enhance analytical capabilities without the need for coding.
So, whether you want to bring in additional data sources or conduct more complex analyses, the inherent flexibility and scalability of low-code/no-code systems can easily help you with it. Moreover, keep in mind that such platforms are also constantly developing and adding new tools to satisfy evolving needs.
With custom systems, all is way more complex. Want to connect this or that database? Develop a connector. Need a specific graph or chart to visualize your data? Look for a library and fine-tune it accordingly. Therefore, keep in mind that bespoke systems are not that flexible and easy to use in comparison with low-code/no-code ones.
Built-In Visualization Library and Analytical Capabilities

LC/NC platforms feature a huge visualization library and a set of incorporated analytical capabilities that are easy to configure. You don’t have to write code at all; everything you need to do is to select a visualization and data you want to be included and apply filters. And voila — your dashboard is ready in a few seconds.
Read How to Transform Your Business with an Effective Data Analytics Strategy
Machine Learning Capabilities

Advanced low-code/no-code platforms such as Tableau or Power BI also incorporate machine learning capabilities. For example, with built-in algorithms, you are empowered to categorize and analyze data and build various predictions on their basis.
However, it happens that the platform may lack the algorithms you particularly need. It’s a quite unlikely scenario, but if you need something super-custom, there is a solution. The thing is that these platforms provide great opportunities for ML feature expansion. In other words, you can add a missing algorithm manually using Python or another appropriate programming language.
Gaining Control of Customer Engagements
What if every customer could deal with your single most effective sales or service person?
Easy Customization
The easy functionality expansion we’ve mentioned in the previous point appeals not only to machine learning but also to other features your LC/NC platform lacks. Yes, Power BI and Tableau can be easily customized, and if the platform lacks something, you can write the needed piece of code and incorporate it into the working system.
Doesn’t it work in the same way if we speak about a custom-made platform? Not really. Sometimes, adding something new to a bespoke solution turns into a real headache, and here’s why.
For example, you want to add something specific to your bespoke solution. You hire a developer and define a scope of work. But before dealing with alterations, the engineer needs to delve into the system’s specifics and understand how it works.
The first pain point is the time needed for this task. Another is that, as a rule, custom solutions don’t have comprehensive documentation, which means that it’s hard to grasp all the intricacies of the system, and therefore, there’s a high risk of doing something wrong.
As for low-code and no-code data visualization solutions, they are quite typical. There are many business intelligence developers well-versed in these platforms, and they won’t experience any difficulties when adding missing features without a risk of breaking the entire system.
Any Limitations Making You Switch to a Custom Solution? Let’s Sort It Out
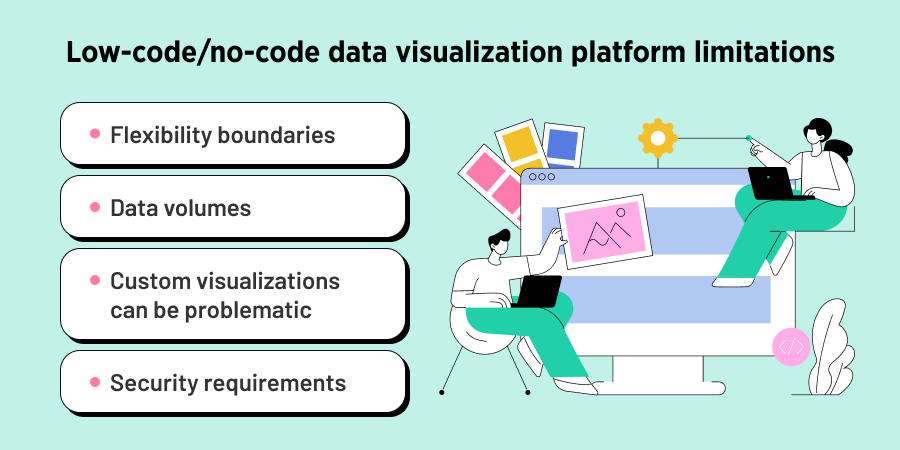
Flexibility Boundaries Still Exist
In the majority of cases, Power BI, Tableau, or Microsoft Fabric will be more than enough to cover all analytical and reporting needs. However, exceptions exist. It happens that companies have specific IT infrastructure, operate in non-typical domains, or require connection to a rarely used database.
Let’s consider the example of OpenAI. For them, it’s much easier and cheaper to develop their own visualization solution, design their infrastructure that would meet all their needs. All because they don’t have to bother with numerous customizations of LC/NC systems and are sure that won’t rest against platform limitations in the end.
Or there are cases when you want to extract data from a specific database your low-code or no-code data visualization platform is not connected with. Sure thing, you can develop your own custom connector, but this will take much time and effort. Moreover, this solution may turn out to be not cost-effective and even not work in the expected way.
But what to do if you already have an LC/NC platform and are thinking over the development of a connector to a needed database? Here, you should consider the existing use cases and decide if the game is worth the candle afterwards. But if there are no any and you are a trailblazer, 99% that it will be much more difficult to create a connector than use a ready-made library and write a custom solution using Python.
Data Volumes Make a Difference
Another limitation worth mentioning is the amount of data you operate with. In the lion’s share of cases, conditional Power BI is more than enough for no-code data analytics and visualization. But if you are a global company with a huge staff and client base, you may face slowed system performance due to the exorbitant data volumes you store, process, and visualize.
That’s why it’s essential to carefully design the architecture of your solution initially to safeguard yourself from performance issues in the future. Also, don’t forget about the cost of this pleasure — the more data your platform handles, the more you have to pay.
Check out Key Steps to Build a Robust BI System
Difficulty to Implement Custom Visualizations
It happens that users want to visualize their data in a specific graph or chart, which is absent in a standard solution. Or a similar visualization exists but requires some modifications. For example, you need additional designations on your graph or wish to combine several types of diagrams.
Unfortunately, low-code and no-code data visualization platforms are initially not sharpened by these kinds of tasks. And here, you have several options to select from: whether to purchase them from a store or to pay a developer who could build a custom one specifically for you.
Security Requirements
Low-code and no-code data visualization solutions typically operate in cloud environments, which can present challenges for certain organizations, especially those with strict data governance needs. For instance, state-owned companies or those in regulated industries often have specific requirements for server location. Many need to ensure that data is stored domestically, within the same country in which they operate, to comply with local data residency laws.
Moreover, security and compliance regulations vary widely across regions, adding another layer of complexity to platform selection. Sensitive industries like finance, healthcare, and government have unique standards for data handling and storage that must be met to ensure regulatory compliance and safeguard data integrity.
Before choosing a low-code/no-code platform, it’s essential to confirm that it not only meets technical needs but also aligns with all security, compliance, and data residency requirements specific to your industry and location.
Transition to Custom. Timelines, Complexity, and If It Makes Any Sense In General

Well, are there any cases when you might want to switch to a custom visualization solution? Of course, they exist, but not that many, in our opinion. Generally, all advanced data visualization platforms are capable of covering almost all requirements of their users since all the related tasks are more or less typical.
However, it happens when a company rests against platform limitations and understands that it’s no longer enough and has no other choice than to switch to a custom solution. Meanwhile, there’s another category of businesses that want to abandon a low-code/no-code solution without any valid reason, just on a whim.
So, how labor-intensive, complex, and time-consuming is this task in general? Well, if you already have ready-made reports and clear calculations, it won’t be a difficult task to migrate them to a bespoke platform.
Read how we built a Custom Data Analytics and Reporting Solution for Real Estate Data Service Provider
As for timelines and efforts you have to put, migration can’t be conducted as if by magic. First, remember that you can’t abandon your old system right away; you have to support it until your new solution is fully ready to be used. Second, if you have complex reports and huge data volumes, this will inevitably take at least a year or maybe even more.
Wrapping Up
Low-code and no-code data solutions certainly address most data analytics and reporting needs, providing rapid insights and streamlined workflows. However, careful platform selection is essential: if you have long-term business growth plans, it’s wise to consider a comprehensive solution, like Microsoft Fabric or Power BI. With these robust platforms, the likelihood of hitting limitations down the road is minimal, allowing you to scale seamlessly.
Unsure how to navigate the vast landscape of visualization tools? Our team of experienced engineers specializes in low-code/no-code development and advanced data management. Reach out to us, and we’ll guide you in selecting and implementing the best-fit solution to meet your business goals.


